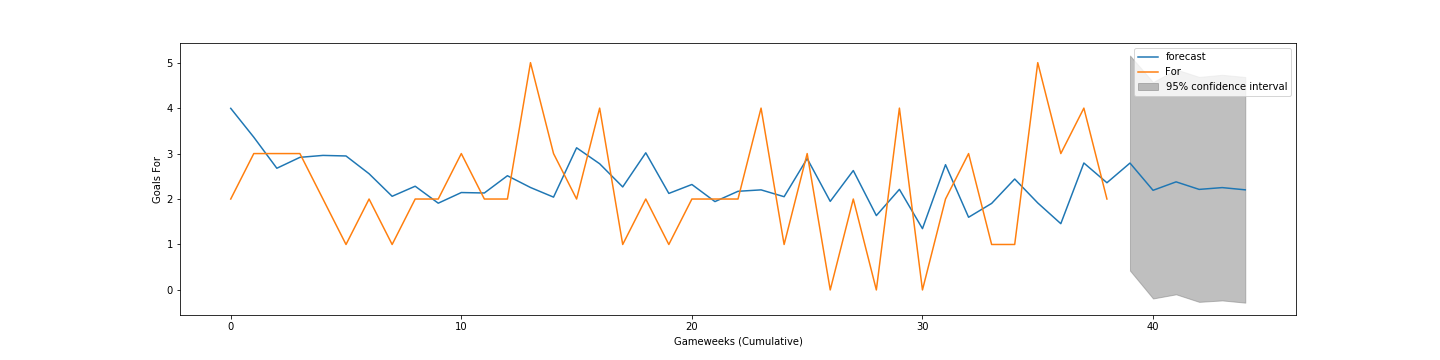
New iteration of an old thread. I’ve been doing some tinkering with machine learning in Python and generated a very basic prediction graph of our League goals scored since the start of last season (orange actual, blue predicted) and how many we’re predicted to score in the future (grey). Hey, if we score two goals a game moving forward, that’s solid (provided we keep our “run” of clean sheets going).
1 Like
Can you throw some light on what parameters have you considered for the prediction, mate? Also for the orange graph, have you considered the data before these games? Would love to understand how this has been arrived at.
Think there will be just too many attributes to be considered and perhaps there are only some which becomes relevant?
1 Like
Thanks for inquiring! I am pretty new at machine learning so definitely don’t have all the answers, and always open for feedback.
Where the data came from: This is literally just running an ARIMA (AutoRegressive Integrated Moving Average) model that was run on our “goals for” tally in each Premier League game for 2019-20 (orange line). The model then establishes predictions (blue line) based on the average. The real thing to pay attention to is the blue line within the grey area: this is the “forecast.” Perhaps I didn’t specify well enough earlier when I said the forecast was grey — in actuality, it’s the blue line within the grey, while the grey is the 95% confidence interval, meaning that the values should fall within that range with 95% confidence.
Attributes: As for your point regarding there being a lot of attributes that we could examine, you’re right, but it’s very much a trade-off sort of deal. On the one hand, I could have used more numbers, and the more data points you have, the more there is to reference when the model runs — it’s particularly helpful when there are additional points like logarithms and squares that can be generated and correlated. However, in addition to being generally more complicated, it would have taken longer to build and with little more to be gained. Actually, I had initially included all games back to the start of the 16-17 season, but excluded them after the graph got wonky (there were huge peaks and valleys because of the breaks between the seasons). Time series trends are best done when there are consistent data points rather than a 3-month break between seasons (or, in this year’s case, during the season).
How the model runs: With machine learning, data is broken up into a “train-test split”, where the model “trains” itself based on a certain part of the dataset, while it makes predictions based on the other part. With ARIMA, it’s 70% training, 30% testing, so the model takes the data and splits it 70-30, and works its magic from there.
Length of Forecast: I only went 5 games out from the current timeframe, as the further out you go — and the less “training data” you have — the more inaccurate the predictions get (the grey area would get larger, while the blue line would remain relatively stagnant). If I had done the four full seasons of training data, I would have perhaps predicted out longer, but since it was a relatively small sample size I figured it would make the most sense to keep it brief.
1 Like
Even am new to ML, but curious to learn more. Somewhere I believe predicting number of goals is not straight forward, and 95% confidence level for goals between zero and five is sort of given. Will check on ARIMA nonetheless 
1 Like