I cant sue her. I’m in over my head already.
1 Like
1 Like
I dont need to know what you get up to…Christ.
On a serious note, I am livid about this. I have a friend who works in the Ambulance service so I have a little bit of an inside track on what it’s like working for the Ambulance service. It is honestly a joke. Severely under resourced and not helped by A&E services being overloaded by again a lack of resources but other services being directed there.
2 Likes
Nothing of any note. I’m not allowed.
The majority of people do wear face coverings, but each time I go to a supermarket, I see a few who don’t and they are never challenged. This week, I noticed a definite increase in the number not wearing a covering.
1 Like
It doesnt matter anyway its all sexed up 

A few weeks ago I was in my local newsagents and the guy behind the counter (not wearing a mask) was as usual sounding off to a customer, also not masked up, that it was all bullshit (his word) and he was not ever going to wear one as it infringed his civil liberties. Needless to say he has lost my trade now.
4 Likes
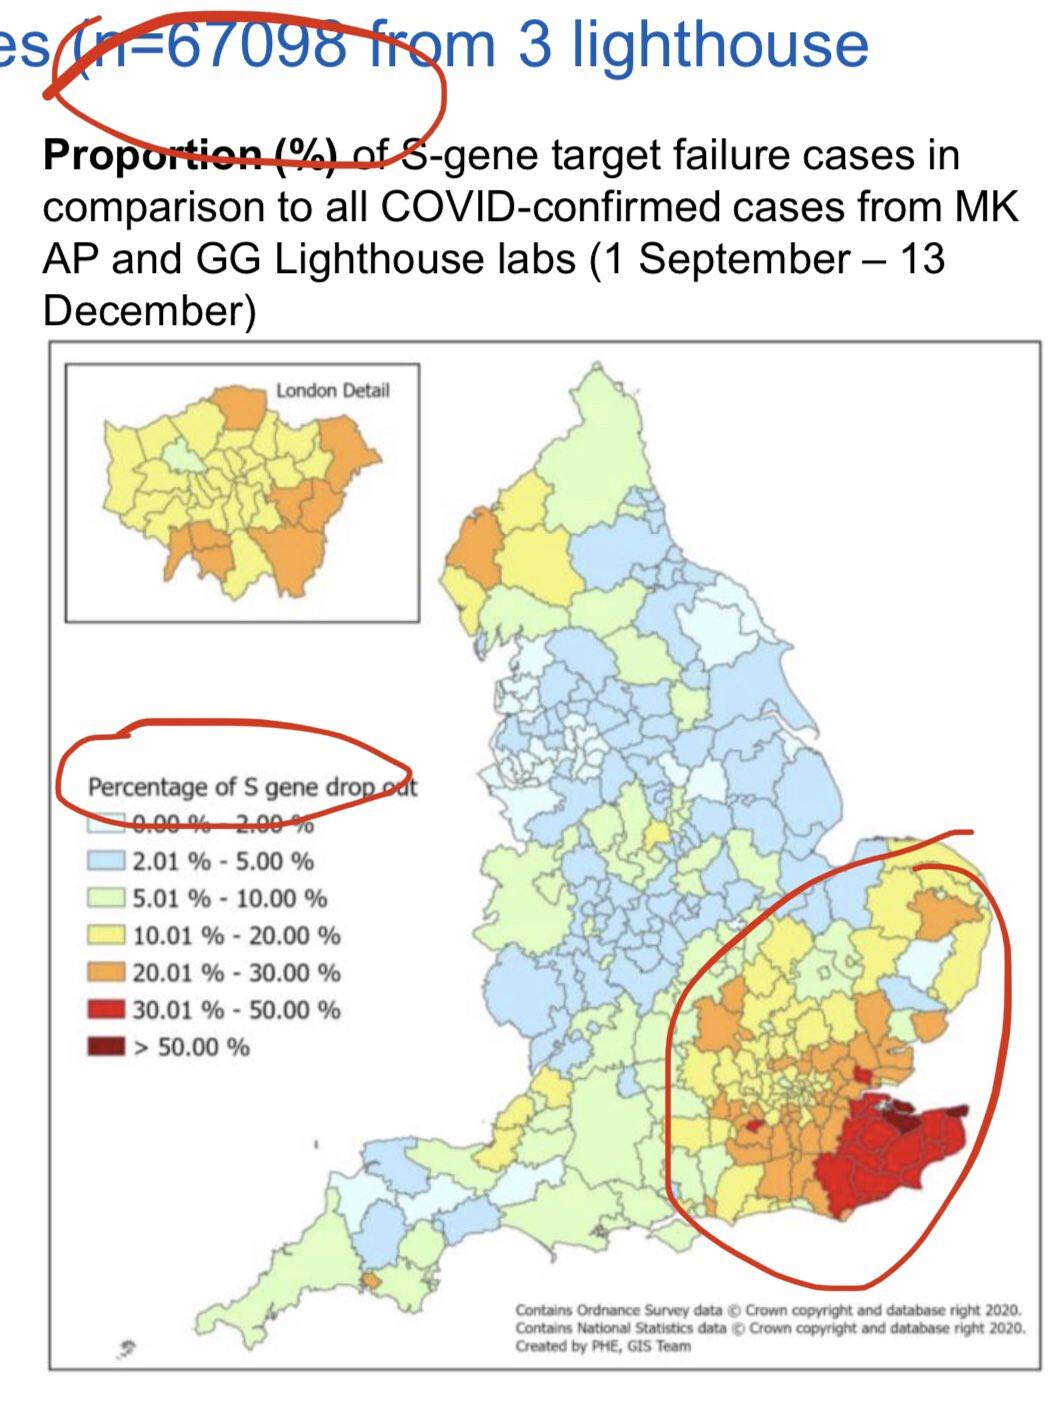
Could you explain the difference in those two maps, as they bear dates for the same period?
1 Like
Absolute count versus percentage. London will always show up as dark red in the absolute count of just about anything, but when you see it by percentage of cases the picture shifts.
I can sort of see why the EU were startled, looking at that percentage map.
5 Likes
I am still oblivious - do you mean actual spread to expected?
No - in the past 24 hours it has been discovered that the PCR test used by Lighthouse labs actually gives a proxy for testing for the variant, without it having been genetically sequenced. To simplify, that PCR test reports a positive on aggregate, but negative on one particular attribute, for the protein associated with the spike where that spike has that mutation.
So the dataset of all Lighthouse tests for the period has a proxy for distribution and emergence. The maps show only distribution. The first map shows how many S-gene failure cases were detected in a given area over that time span. Take Dover for example (I think I am seeing the boundaries correctly…). First map says Dover had 351-600 instances of a positive test where the S-gene target failure occurred, i.e the mutation. But Dover is not that big of a place. Somewhere between 30-50% of all cases in Dover have the characteristic, which is true for most of Kent. By contrast, London’s eastern suburbs have a considerable number of cases (801-1300 in a belt of areas), but they have a lot of cases of all variants - as a percentage of the positives, the mutation is seen in less than 30%, indeed in less than 20% in some.
Similar observation for what I think is Manchester and Birmingham(?) on the first map, they simply disappear. There is just a lot of covid in those two red areas, but the mutation is not a significant percentage per the second map.
3 Likes
Yes, high percentage cases around the ports of Ramsgate, Dover and Folkestone and also close to Felixstowe I see. How peculiar…
What are you saying then?
I just think it’s interesting. Its first point of contact may have been with port workers or hauliers.
3 Likes
That map would be consistent with a very high risk of transmission to the EU. It would also be consistent with original transmission from the EU. It is probably now a critical priority to try to develop similar data for the Calais end.
5 Likes
Not sure if that was directed to me or to Kopstar - I am not saying anything, I am looking at a map and trying to understand what it might indicate.
But for that one area on the west edge of the Scottish border (Cumbria?), that looks like a radiation pattern.
2 Likes
It was to @Kopstar, and thanks for explaining, what is, a difficult set of charts.
My main insight so far is that Birmingham really isn’t where I think it is…
What are the major haulage routes to the Glasgow area? I assume the M6 would be the major artery ?Would that be a possible explanation for why Carlisle has a higher level, albeit without explaining why other areas en route don’t show the same frequency - there would have to be some reason why a disproportionate number of trucks would stop in the Carlisle area, creating an increased number of opportunities to spread.
2 Likes