That would provide for some entertaining TV ![]()
Not sure the current machines are wide enough to capture the arcs of the needle, or enough paper, or ink…
I think Our World in Data touched on this point, and mentioned why they specifically used a regression for comparison rather than actual numbers.
Death statistics aren’t static, they change with your population. E.g. if your population is greying/ageing, ceteris paribus, you’d expect your mortality rates to increase. If on the other hand, you receive an influx of immigration of largely younger population (again, assuming no other differences from the rest of the resident population), you would expect mortality rates to be decreasing. If the standard of living and medical care is improving, you’d similarly expect improving mortality rates.
You can see this in the data you showed itself, every single data point above 2020’s rates is pre-2003, while the years immediately preceding 2020 are clustered together further down the table. 2020 itself is an outlier.
Our World in Data try to mitigate this problem by basing it off a regression, i.e. predicting what death rates would have been normally, and then using that as a baseline to estimate excess mortality.
2 Likes
So let me get this straight, you want solid fact and not hypotheticals on this point, but you are willing to assuming that every other politician is involved in tax-dodging?
Sunak is the only contender for Prime Minister with proven links to tax-dodging.
Again you’re doing a lot of mental gymnastics to defend a party you don’t claim to support.
3 Likes
Or get a room?
Let me get this straight.
You falsely claim I misquoted you and then object when I add a screenshot of what you said, which refutes your false claim?
Maybe try not suggesting I’m a liar.
Incidentally, the screenshot I took just over two years ago, at the time it was made. I tend to take screenshots of comments that are, shall we say, over the line. They’re examples, only a few from you tbf, of things said that are FAR worse than anything I’ve ever said either here or on TIA.
Let’s not do this here. I’ll send you a DM.
2 Likes
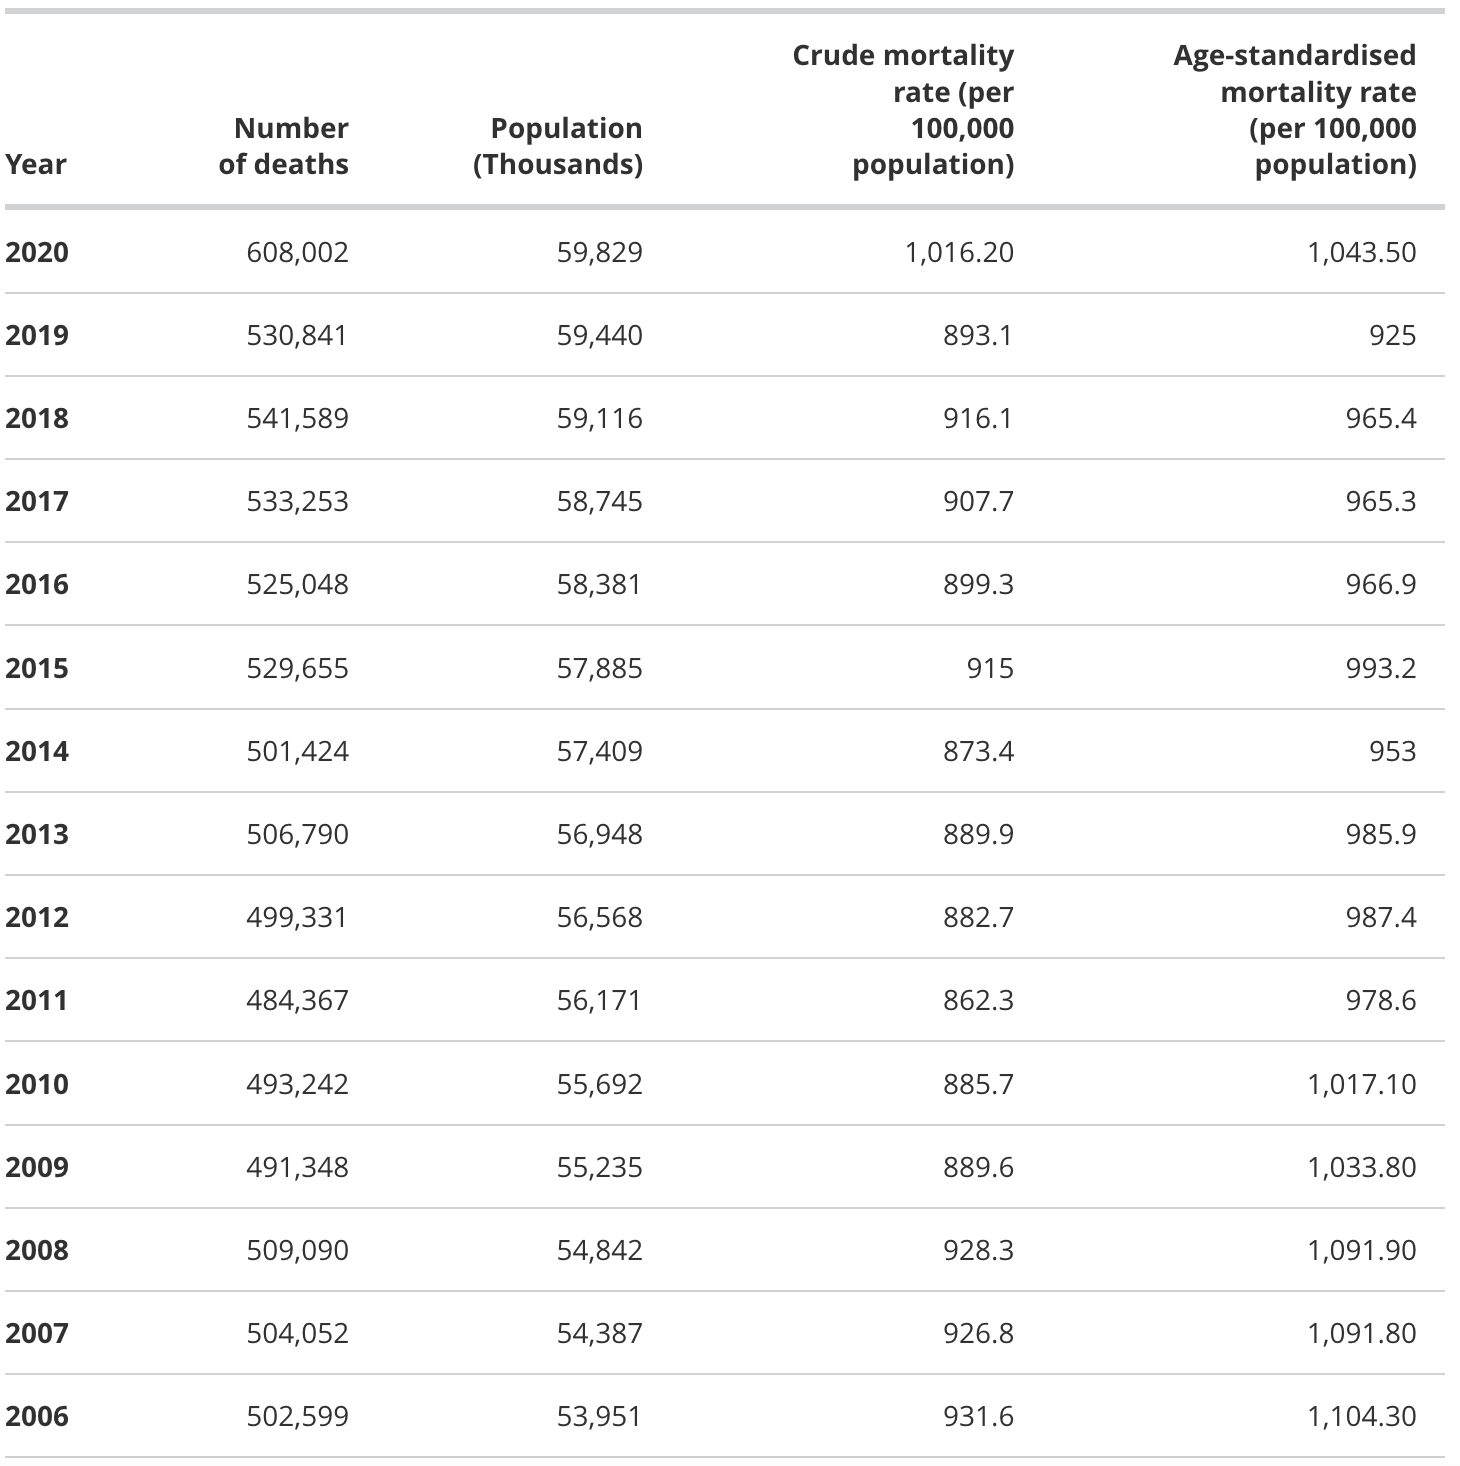
Did you look at the chart and the link to the data? If you did, you’d see the 5th column is adjusted for demographics, exactly what you describe. the CRUDE mortality rate is column 4, where 2020 is sitting smack in the middle. Note that with even 9,000,000,000 less population in 1993, the total number of deaths in the country is within 30,000 of 2020. That’s some pretty damning DATA that suggests that the Labour Party is NOT saving 180,000 people from death as @Mascot would like to think.
I don’t even know who the Labour Party is FFS. But those are FACTS, supported by DATA. The difference between 2018 and 2020 is only 67,000 deaths, when there was no pandemic. 78,000 difference between 2019 and 2020…
and those are gross numbers. last year, 2556 people died from a heat wave. Who would have saved them?
I’m assuming you meant 9million?
Did you take into account smoking, environmental pollution and improvements in preventative medicine? You are trying to compare like for like but without a breakdown of causes of death you can’t draw any conclusion. That’s why excess deaths tend to be used as a definitive measure - how many people actually died compared to how many would be statistically expected.
2 Likes
This thread is reducing the life expectancy of many, I fear ![]()
2 Likes
I wonder how austerity affected those figures?
NHS cuts as well thinking about it.
No I did not, but I have now, and it’s even worse than you think.
Firstly, the fifth column that you mention, I think the contrast is pretty stark and speaks for itself. However, I mentioned age as only one of the factors that could potentially affect it. Other factors, especially socio-economic ones could well change those factors adversely.
Secondly, you do agree that the difference in deaths between 2020 and 2019 or 2018 is around 78k and 67k deaths. Note that both are on a baseline of around 540k, which means a 10+% increase. Not the big gotcha that you thought it was.
Thirdly, you do realise that those are just the figures for 2020, which was nowhere close to as major a wave as the subsequent years have been. While it was no doubt the scariest, especially since media fatigue hadn’t set in yet, the raw infection figures weren’t as high, and naturally the death rates weren’t as high. Perhaps the 2021 figures will be even more damning than the 2020 figures are, but even if they aren’t majorly different, twice that is already, taking your lowest crude figure, 134k excess deaths. Not including 2022. Presumably fewer people are dying in 2022 than they were in 2021 or 2020. But 134k is not too far off from 180k to see where they are coming from.
This is presumably factored into the average I was talking about. But quite clearly you didn’t read the link I provided to the data from Our World in Data, where they explained their methodology.
Facts, supported by data.
1 Like
I’m guessing the answer is no, combined with a poor understanding of statistics/data. Furthermore, the 2020 figures, as stated by the ONS on that page notes that those figures are provisional. Without knowing how they estimate mortality and just assuming that they measure it by the number of deaths actually recorded in the statistics, one could easily argue that if anything, the death count in 2020 is likely to be even higher than in those numbers.
At the end of the day, 180,000 people have died of covid. Any statistical analysis that suggests that isn’t a thing is either not reliable or not being read properly.
Unless something has changed, isn’t the argument (rightly so) that many people had conditions which meant that they would have died anyway, happened to have tested positive for COVID within 28 days (which is, I believe, the official definition), and therefore have been recorded as dying from COVID?

The BBC has the excess deaths figure at 157,244 for the period of 13 March 2020 to 01 July 2022, citing the ONS. Oddly enough, the ONS itself suggests a figure of 180,642 across England and Wales, with an excess deaths of 139,042.
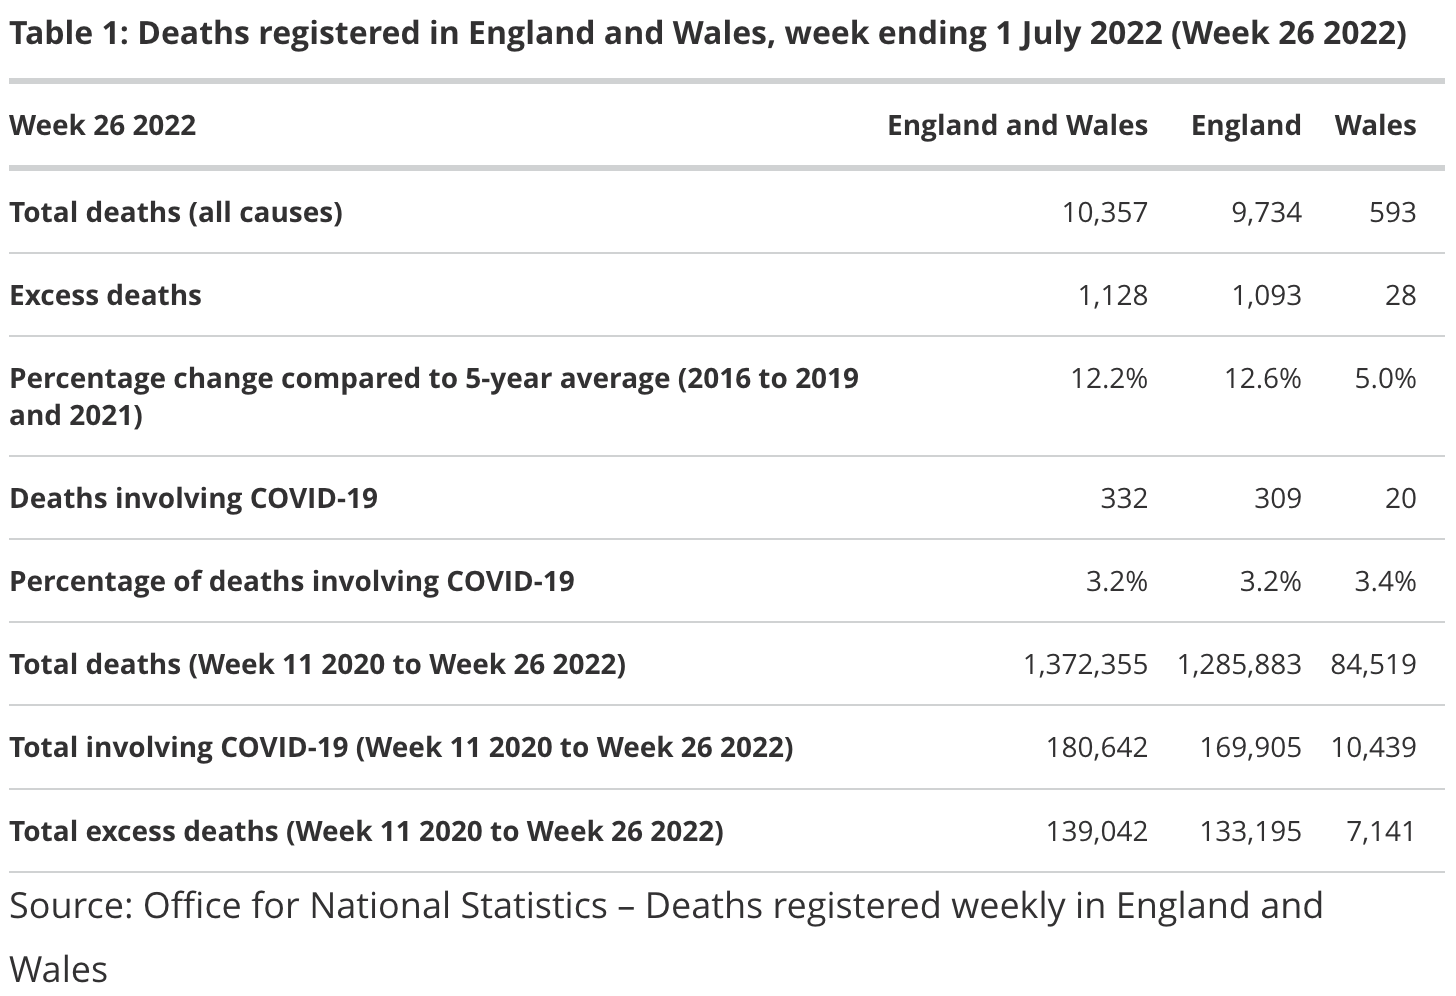
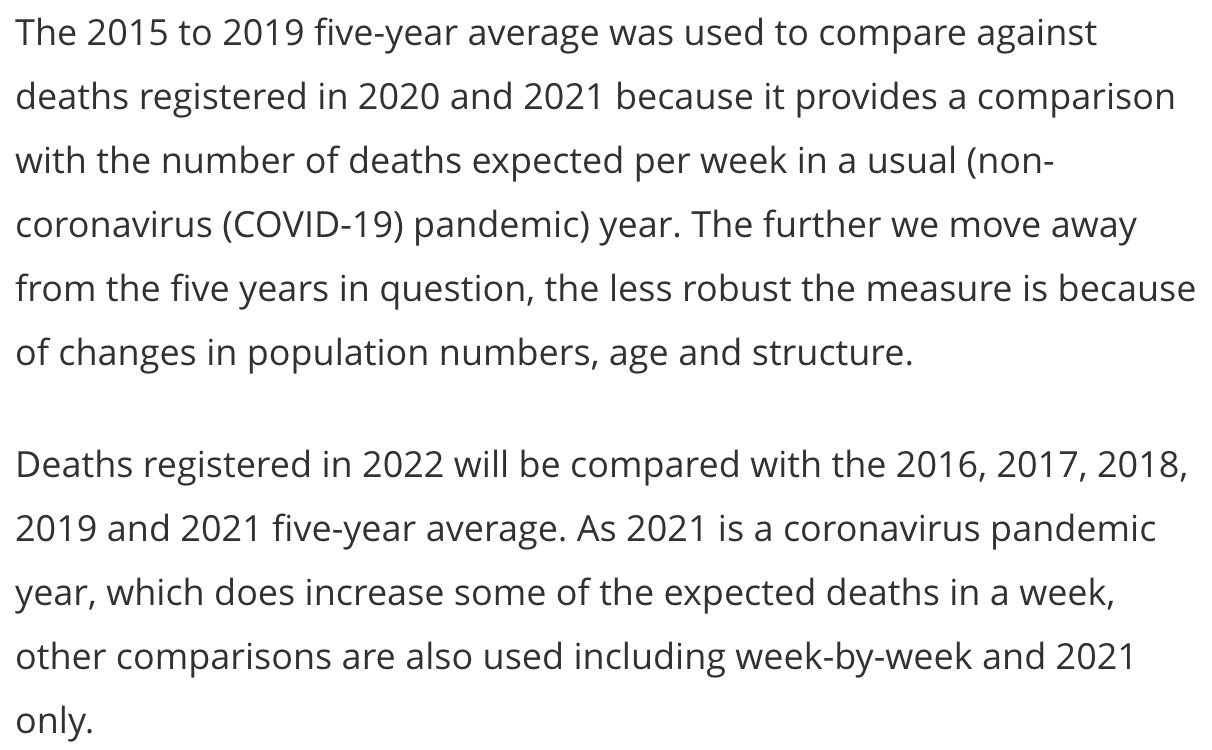
EDIT: The ONS uses a 5 year average to estimate excess deaths, with 2020 omitted as a source for this average, as per the below.
1 Like
I think you also have to bear in mind that the deaths from other factors would have fallen dramatically at the same time time as well, as people were locked down, staying at home, more cautious, normal viruses weren’t spreading etc.
1 Like
at the end of the day, 180,000 people have died with COVID on their death certificate. But once you account for co-morbidities that number is a bit misleading.
as an example, Canadian government even recognized this through StatsCan
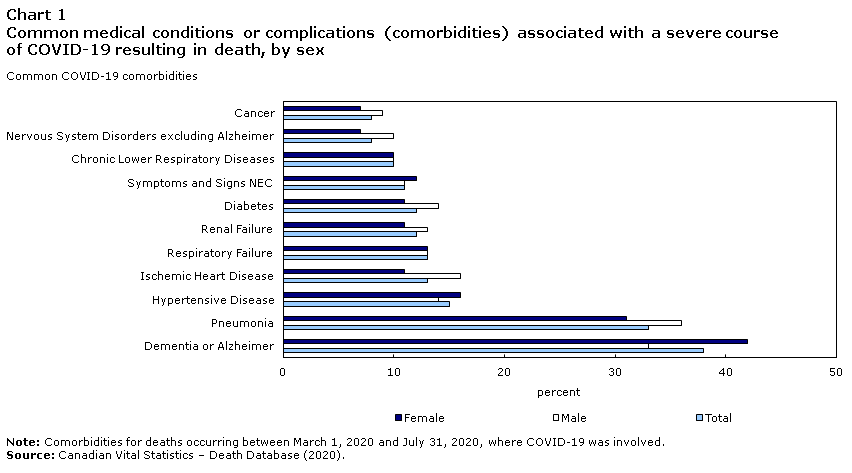
1 Like
That’s why I prefer to look at the excess deaths figure, since it (a) takes into account trends, (b) smooths out the anomalies, and (c) is able to directly compare a particular time period with its predecessors. We can say that all these excess deaths will have been contributed to massively by that one factor, but we can’t definitively say that all deaths with that one factor involved were caused by that.
This is the other end of the same argument, in my opinion. You’re arguing that a co-morbidity is sufficient to displace COVID as a reason for their deaths, when in reality, COVID often worsens the outcomes for many of those conditions, diseases, and complications.
For example, maybe dementia or Alzheimer’s has absolutely nothing to do with COVID, but they are also far more likely to affect the elderly, who are more vulnerable to begin with. Would they have died during this time period from their dementia or Alzheimer’s? Not very likely. On the other hand, something like cancer produces a relatively high death rate, and is unlikely to interact with COVID unless the patient was undergoing treatment that would suppress their immune systems. Perhaps you can say that the deaths in this case are very easily misattributed. Then you have pneumonia, hypertensive disease, heart disease, respiratory failure, chronic lower respiratory diseases, all of which are likely to be substantially worsened by COVID.
All of those deaths were recorded with COVID, but some of them (cancer) could be the main cause, and the COVID was coincidental. Some of them (cardiovascular and respiratory-related), COVID is very likely to have caused, or at least pushed over the edge. Some of them (dementia or Alzheimer’s) are very likely to not have caused death otherwise, so COVID is a far more likely cause.
1 Like
this is why they are called co-morbidities. the deceased may have hung on for another year or two but the NCov19 virus is what tipped the scales, so to speak.
all of the numbers point towards Covid not being a direct killer of many, but to have been a contributing factor in the death of the sick and elderly who have weak or compromised immune systems.
I’m not entirely sure that’s why they’re called co-morbidities.
It’s just that they happened to have all those when they died. Nothing particularly causal about that…
Again, I would disagree about “not being a direct killer of many”, since they may well have soldiered on until they got COVID, which is what killed them off.